Pearson correlation coefficient aims to measure the strength of the relationship between two variables. In this tutorial, we will introduce it for machine learning beginners.
Pearson Correlation Coefficient
There are two types of pearson correlation coefficient: pearson correlation coefficient in population and pearson correlation coefficient in sample.
As to population, population correlation coefficient is defined as:
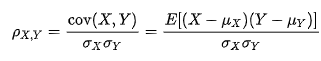
Here \(cov(X, y)\) is the covariance of X and Y,\(\sigma_X\) and \(\sigma_Y\) are the standard deviation of X and Y.
As to sample, sample correlation coefficient is defined as:
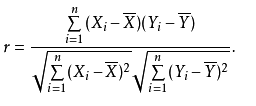
Here \(n\) is the total number of a sample, \(\overline{X}\) and \(\overline{Y}\) are the mean of X and Y.
The value of pearson correlation coefficient
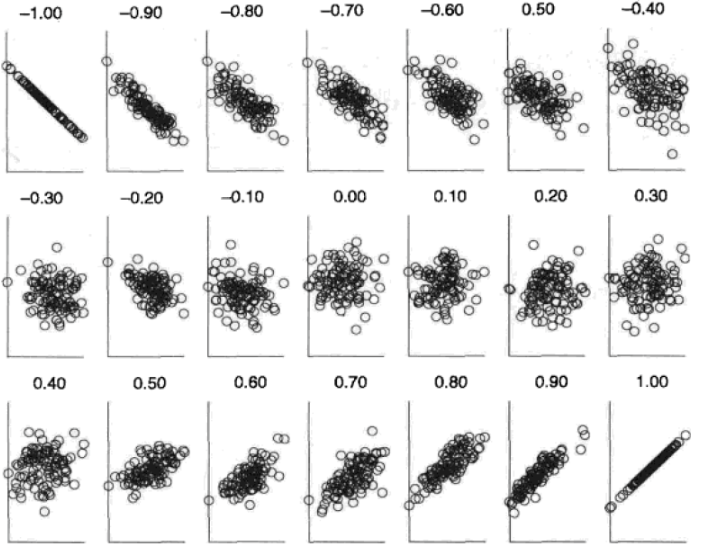
The value of pearson correlation coefficient is in [-1, 1]
- -1: negative correlation
- 0: no correlation
- 1: positive correlation
Moreover, it can be viewed as:
- .00-.19: very weak
- .20-.39: weak
- .40-.59: moderate
- .60-.79: strong
- .80-1.0: very strong
Here is an picture to show the correlation.